A flexible composition biogeochemical model (Figure 1,2) that includes Fe cycling and Fe limitation was applied to the Southern Ocean. The model includes two phytoplankton groups, diatoms and nonsiliceous forms. Uptake of NO3- by phytoplankton is light-dependent, but NH4+, Si(OH)4 and Fe uptake are not and can therefore continue through the night. The model tracks the resulting C/N and Fe/C ratios of both groups and Si/N ratio of diatoms, and permits uptake of C, N, Fe and Si to proceed independently when those ratios are close to those of nutrient-replete phytoplankton. When they indicate a deficiency cellular C, N, Fe or Si, uptake of the non-limiting elements is controlled by the content of the limiting element in accordance with the cell-quota formulation of Droop (1974). The model thus identifies the growth-limiting element and quantifies the degree of limitation from the elemental composition of the phytoplankton.
We applied this model at the French KERFIX site in the Indian Ocean sector of the Southern Ocean, using meteorological forcing for that site from 1991-1995. The flexible-composition structure provides simulations that are consistent with field data with only minimal tuning of model parameters. The model reproduces the high-nutrient, low-chlorophyll (HNLC) conditions observed at the KERFIX using much lower and more realistic grazing loss terms than those used in KERFIX simulations that do not include Fe limitation. Cellular Fe/C ratios indicate that both diatoms and nonsiliceous phytoplankton are strongly limited by interaction between Fe limitation and low irradiance throughout most of the year in these simulations, with grazing a significant secondary factor.
Figure 1 - Conceptual drawing of the biogeochemical model applied
to the KERFIX Time Series.
Legend: Red line : Specific nitrogen cycles fluxes;
Green line: Specific carbon cycle fluxes;
Blue line: Specific Silicon cycle fluxes;
Dark line: Common carbon and nitrogen cycle fluxes;
Orange line : Specific iron cycle fluxes;
Fe: Dissolved bioavailable iron;
Si(OH)4: Dissolved silicic acid;
DIC: Dissolved inorganic carbon;
NO3: Nitrate;
NH4: Ammonium;
Dia: Diatoms (carbon, nitrogen, silicon, iron) C/N Si/N Fe/C variable;
Pico: Picophytoplankton (carbon, nitrogen, iron) C/N Fe/C variable;
Bac: bacterial (carbon, nitrogen) C/N fixed;
Mzoo: mesozooplankton (carbon, nitrogen) C/N fixed;
Uzoo: microzooplankton (carbon, nitrogen) C/N fixed;
Sdet: Small sized detritus class (carbon, nitrogen, silicon, iron) C/N Si/N Fe/C variable;
Ldet: Large sized detritus class (carbon, nitrogen, silicon, iron) C/N Si/N Fe/C variable
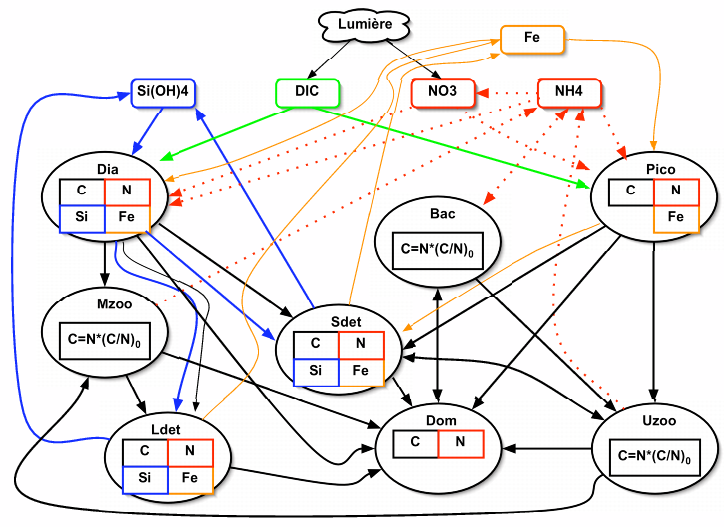
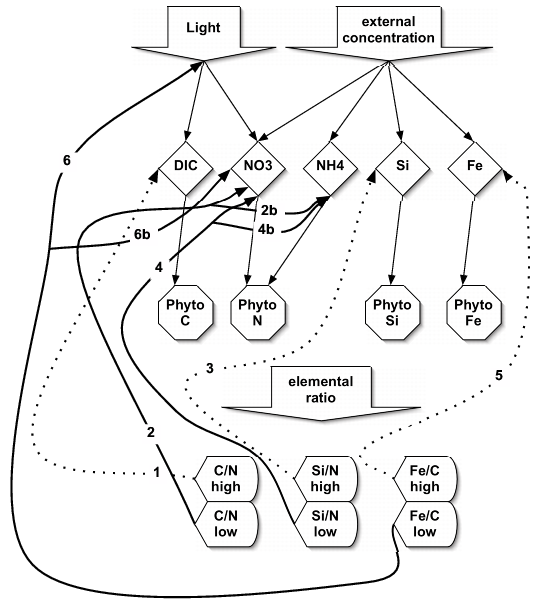
Figure 2 - Schematic of elemental composition control by
the modified Droop (1974) model.
Legend: 1: phytoplankton C/N control on the photosynthesis;
2: phytoplankton C/N control on the NO3- and NH4+ uptake;
3 :Diatoms Si/N control on the Si(OH)4 uptake;
4 : Diatoms Si/N control on the NO3- and NH4+ uptake;
5 : Phytoplankton Fe/C control on the Fe uptake;
6: Phytoplankton Fe/C control on the photosynthesis
Simulations:
Six simulations were run in the Southern Ocean with results presented for a 5 year period begining 11 July 1990. Results are presented as mean values within the mixed layer. The model was run both with and without iron limitation and three levels of grazing pressure, yielding the following six simulations:
| Fe Limitation | No Fe Limitation | |
| Grazing * 0.5 | MEAN1-I-05G | MEAN4-NoI-05G |
| Grazing * 1.0 | MEAN2-I-1G | MEAN5-NoI-1G |
| Grazing * 2.0 | MEAN3-I-2G | MEAN6-NoI-2G |
Output Variables:
| Variable Name | Variable description/definition |
| MLD | mixed layer depth (meters) |
| kmld | mixed layer depth level |
| meanno3 | nitrate concentration (mmol N/m3) |
| meansin | diatom Si/N ratio (mol/mol) |
| meanzol | mesozooplankton biomass (mmol C/m3) |
| meanzos | microzooplankton biomass (mmol C/m3) |
| meannh4 | ammonium concentration (mmol N/m3) |
| meansil | silicate concentration (mmol Si(OH)4/m3) |
| meanfer | bioavailable iron concentration (mmol Fe/m3) |
| meandia | diatom biomass (mmol C/m3) |
| meanphy | non-siliceous phytoplankton biomass (mmol C/m3) |
| meanalfpp | alpha/alpha-max (P-I photosynthetic initial slope) for non-siliceous phytoplankton |
| meanalf | alpha/alpha-max (P-I photosynthetic initial slope) for diatoms |
| meanchla1 | non-siliceous phytoplankton chlorophyll concentration (mg Chla/m3) |
| meanchla2 | diatom chlorophyll concentration (mg Chla/m3) |
| meanfcdia | diatom Fe/C ratio (umol Fe/mol C) |
| meanfcpic | non-siliceous phytoplankton Fe/C ratio (umol Fe/mol C) |
| meancnd | diatom C/N ratio (mol C/mol N) |
| meancnp | non-siliceous phytoplankton C/N ratio (mol C/mol N) |
Institut Universitaire Europien de la Mer - UMR CNRS 6539
Technopole Brest-Iroise
Place Nicolas Copernic
F-29280 Plouzané, France
tel: 541-737-21-86
email: mongin@univ-brest.fr