19 Control of primary production in the North Atlantic Ocean
Charles S. Yentsch
Bigelow Laboratory for Ocean Sciences
West Boothbay Harbor, ME
[Editor's note: Yentsch had to leave before his talk could be
presented. The following is edited from a message sent after the
meeting.]
What I had hoped to talk about concerns my conception of how organic
production works in the North Atlantic basin. To be brief, the
message is that ocean color analysis from satellite has confirmed
the traditional ideas concerning regulation of primary production.
What I find interesting is that the baroclinic features created
by the circulation in the North Atlantic basin potentially dictate
the pattern of primary production. The added input of change in
mixed layer depth provides the marked seasonality. It is a truly
beautiful system to study carbon dioxide interactions and species
diversity and biogeography in general. To study these processes
properly, there is a real need for marriage between JGOFS and
GLOBEC.
Consider Figure 19.1 showing the 200 meter nitrate concentration
in the basin. It fits the pattern of satellite derived chlorophyll
very well. It also fits the pattern of general circulation as
defined by the Gulf Stream and the Equatorial Currents shown in
Figure 19.2. Looking at the section which dissects the basin on
its side reveals two mountains of nitrate separated by a valley
which is the Sargasso Sea (Figure 19.3). Figure 19.4 shows the
familiar nitrate-density relationship for the western part of
the basin. Garside has data for the entire basin. In any case
the major point is that sigma-t 27.5 is the nitrate maximum, which
when viewed from North to South reinforces the dominance of circulation
on the deepwater pattern of nitrate (Figure 19.5). Superimposed
on the nitrate and density distributions is the productivity which
also reflects the bimodal distributions. Note that the equatorial
region has as much nitrate at depth but the productivity is lower.
This is because the mixed layer is shallower at equatorial latitudes.
The above convinced me that the system looked like the half toroid
shown in Figure 19.6. This is consistent with how most physical
oceanographers see the system--the top of the beta spiral is sort
of an eddy or a badly sprung flywheel (Stommel). I have until
recently, been reluctant to assign the relative importance of
upwelling in the system--even though the white arrows reflect
the general direction of surface winds. Yet these sequences must
be extremely important in the establishment of the productivity
pattern. The North Atlantic is full of regions of variable upwelling
and downwelling which probably convolute the patterns of CO2 shown
by Takahashi. Would it not be feasible to identify one of these
and examine the time and space change in CO2 fields (JGOFS)? The
same type of experiment could be performed examining species diversity
(GLOBEC).
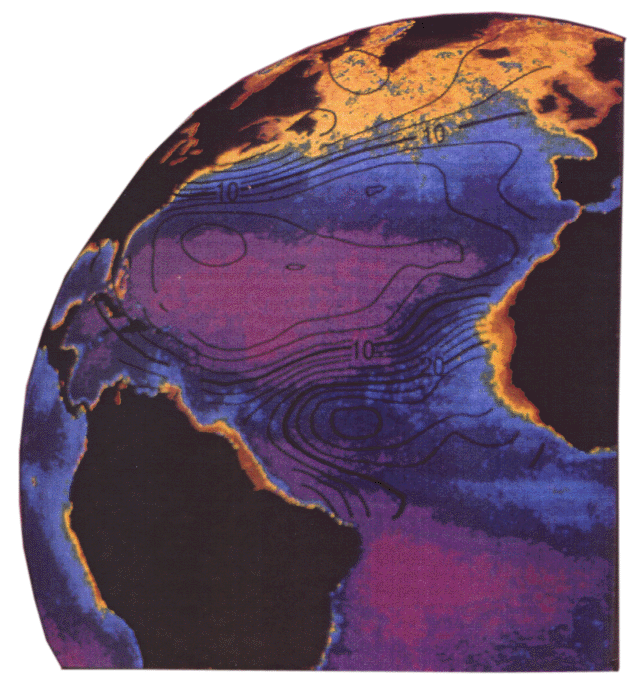 Figure 19.1. The pattern of nitrate-nitrogen (um kg-1) at 200
meters in the North Atlantic, superimposed on ocean color composite
of the North Atlantic. Yellow indicates a high concentration of
chlorophyll, blue is intermediate and purple is low chlorophyll.
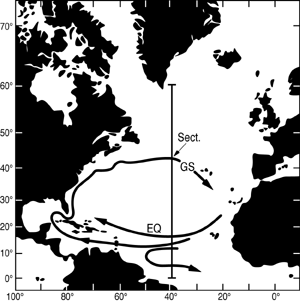
Figure 19.2. Circulation in the North Atlantic. The N-S section
is along 40 West longitude.

Figure 19.3. Vertical distribution of nitrate nitrogen along 40
W section shown in Figure 19.2.
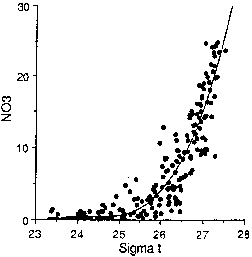
Figure 19.4. Nitrate-density relationship for the western North
Atlantic.
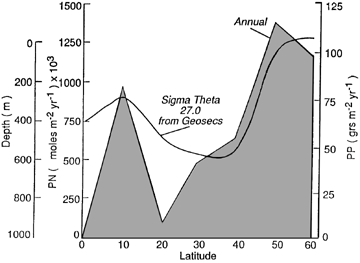
Figure 19.5. Annual latitudinal primary production of particulate
nitrogen (PN) and carbon (PP) at Long. 40 West.
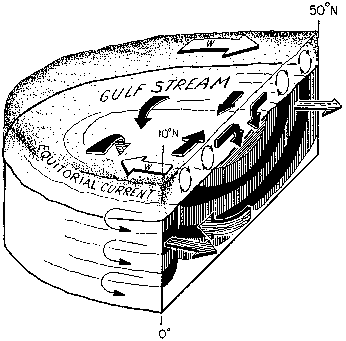
Figure 19.6. Schematic representation of wind stress and the resultant
convergent circulation. Mass balance is retained through isopycnal
transports intercepting the surface layer at 10 and 50 North.
Stippling represents areas of high production.
 Figure 19.1. The pattern of nitrate-nitrogen (um kg-1) at 200
meters in the North Atlantic, superimposed on ocean color composite
of the North Atlantic. Yellow indicates a high concentration of
chlorophyll, blue is intermediate and purple is low chlorophyll.


