18 The North Atlantic as a Major Sink for atmospheric CO2
Taro Takahashi
Lamont-Doherty Earth Observatory
Palisades, NY 10964
Abstract:
The North Atlantic represents one of the most important oceanic sink areas for the up take of atmospheric CO2. The seasonal chemistry data obtained in waters of the photic zone at the Icelandic (64°-68°N) and NABE (47°N) sites show that seasonal changes in the CO2 chemistry at these sites can be mostly accounted for in terms of changes in nutrient concentrations and the Redfield ratios. On the contrary, the large seasonal changes in CO2 observed at the BATS (31°N) site are only accompanied with very small changes in the nutrient concentrations. This significantly non-Redfieldian behavior suggests that our understanding of biogeochemical processes governing CO2 and nutrients in the upper oceans is defficient. It is recommended that this and other biogeochemical questions outlined below be addressed in the future JGOFS experiments which are designed to improve our understanding of the North Atlantic carbon cycle.
1. CO2 Chemistry in Surface Waters of the North Atlantic Ocean:
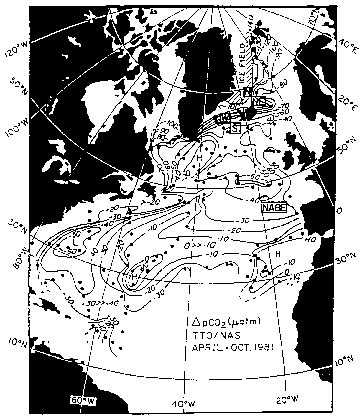
Available surface water pCO2 data indicate that the North Atlantic north of 15°N is one of the most intense oceanic sink areas for atmospheric CO2. Figure 18.1 shows the results of the North Atlantic TTO Study made in April through October, 1981, representing sea-air pCO2 differences after spring phytoplankton blooms were over. With the exception of small areas around 30°N, most of the areas over the North Atlantic Ocean were strongly undersaturated with respect to atmospheric CO2. The Labrador, Greenland and Norwegian Seas were undersaturated by as much as 30% (-140 uatm near Spitsbergen) due to combined effects of photosynthesis and colder temperatures, and represent one of the most intense CO2 sink areas in the global ocean.
The net CO2 fluxes across the sea-air interface over the North Atlantic have been computed (Figure 18.2) for the summer (June-July-August) and winter (Dec.-Jan-Feb.) months using the relationship: F = E*(sea-air pCO2 difference). The mean seasonal pCO2 data over 2°x2° pixels, the 14C-based gas transfer coefficient (E (mol/yr/m2/uatm) = 0.016*[ (wind speed, m/sec)- 3)] (Tans et al., 1990), and the mean monthly wind speed (Esbensen and Kushnir, 1981) were used. The negative values indicate that the ocean is a net sink, and the positive values indicate that it is a net source for atmospheric CO2. The computed net fluxes range from +3 to -8 mol/m2/yr. If the entire global ocean area (3. 6x10¹⁴ m2) had a net CO2 uptake flux of -1 mol/m2/yr uniformly, it should take up 4.3 Gt-C/yr of CO2, about 70% of the current industrial CO2 emission of 6 Gt-C/yr. Thus, the missing CO2 sink of about 3.5 Gt-C/yr may be accounted for by an uniform global CO2 flux of about -0.8 mol/m2/yr into the ocean. Note that the area west of Iceland is a weak CO2 source (about +1 mol/m2/yr) during the winter due to the upwelling of deep water, whereas it is a strong sink (-2 to -4 mol/m2/yr) during the summer due to photosynthesis. Subtropical CO2 source areas are confined to south of 20°N during the winter months, and expand northward to as far north as 38°N during the summer due mainly to warming.
2. Global Perspectives:
The net CO2 fluxes estimated using seasonal pCO2 data over the North Atlantic, North Pacific and Equatorial Oceans are summarized in Table 18.1. Two sets of estimates are given on the basis of formulations for wind speed dependence on the gas transfer coefficient: one

Figure 18.1. Distribution of the sea-air pCO2 difference (in matm) observed during the TTO/NAS Program in the late spring through early autumn (April-October) in 1981 (Takahashi et al., 1982). The values in the areas north of 50°N were obtained during July, August, and September and hence represented the conditions after spring phytoplankton blooms were mostly over. The negative values indicate that the ocean water was a sink for atmospheric CO2 and the positive values indicate that the ocean is a CO2 source. The sites where seasonal changes of the CO2 and nutrient concentrations were investigated are indicated by the boxed letters for the NABE site, and "N", "NE", "W" and "S" for the Iceland sites.
was deduced (Tans et al., 1990) from the distribution of bomb-14C observed in the atmosphere and oceans (Broecker et al., 1986), and the other was obtained (Liss and Merlivat, 1986) based mostly on the measurements made in wind tunnels and over small bodies of waters using gasses (such as oxygen, radon and SF6) which do not form ions by reacting with water. The table shows that the North Atlantic takes up about 8 times more CO2 annually than the North Pacific on the annual average in spite of the fact that the Atlantic has an area about a half of the Pacific. The smaller net flux of the North Pacific Ocean may be attributed in part to high pCO2 values during winter caused by the deep convective mixing during winter cooling. Since subsurface waters of the North Pacific contain substantially greater concentrations of CO2 (2400 umol/kg at about 1000 meters) compared to those found in the North Atlantic (2200 umol/kg at about 1000 meters; Takahashi et al., 1981), upwelling of these waters results in a large increase in pCO2, TCO2 and nutrients in surface waters. The effects of upwelling are reduced by the photosynthetic utilization of CO2 occurring during the spring and summer time.
Table 18.1 - Total annual CO2 flux across the sea surface over the North Atlantic and Pacific Oceans.
Oceanic Areas Total Annual CO2 Flux (Gt-C/yr)Tans et al. (1990) Liss and Merlivat (1986)
N. Atlantic, North of 50°N -0.23 -0.12
N. Atlantic, 15°N - 50°N -0.30 -0.15
N. Pacific, North of 15°N -0.06 -0.03
Equatorial Oceans, 15°N - 15°S +1.30 +0.65 ______________________________________________________________________________
Estimates for the global ocean flux range widely from -0.7±0.3 Gt-C/yr (Tans et al., 1990) to -2.1±0.8 Gt-C/yr (Quay et al., 1992) depending upon the nature of measurements (CO2, 13C or 14C) and models used for interpretations. The North Atlantic accounts for more than a half of the global uptake, if the global estimate by Tans et al. (1990) is taken, whereas it accounts for about 25% of the global flux estimated by Quay et al. (1992). Thus, the North Atlantic plays a highly significant role in oceanic uptake of atmospheric CO2.
3. Seasonal Variability in the North Atlantic:
The seasonal variability of carbon and nutrient chemistry has been observed by Takahashi et al. (1993) at stations located in the vicinity of Iceland (64°N - 68°N) and the NABE site (47°N, 20°W) (see Figure 18.1 for the locations). Figure 18.3 shows a summary of the 7-year observations made between 1983 and 1991 at the Icelandic Stations. Precipitous decline of pCO2 and the concentrations of TCO2 and nutrients in surface waters occurred over a two-week period around the Julian date 150, and was accompanied with a rapid increase in water temperature marking the formation of a well defined shallow mixed layer. Photosynthetic utilization of CO2 and nutrients in surface waters was rapid and efficient as indicated by a rapid decrease of nutrients to near-zero values. As a result, the sea became a strong CO2 sink throughout the summer months. Both the TCO2 and nutrient concentrations started to increase after mid-July and recovered to the full winter values by the end of year.
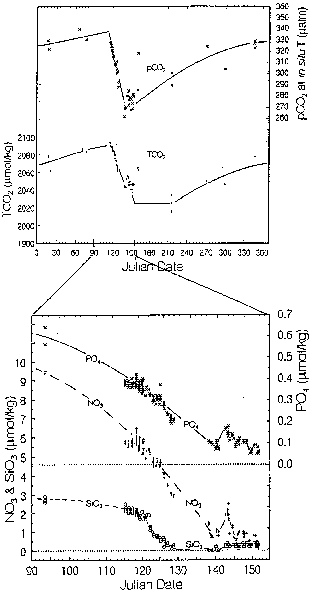
Figure 18.4 shows the seasonal changes observed at the 1989 NABE Station (see Figure 18.1) located at 47°N. The magnitude of changes in CO2 and nutrient concentrations associated with the spring bloom was about 10% smaller than those observed at about 64°N, south of Iceland (DT CO2 = 100 umol/kg, DNO3 = 10 umol/kg and DPO4 = 0.7 umol/kg). Although the CO2 and nutrient concentrations in surface waters were reduced rapidly by the end of the bloom signified by near-zero nutrients in surface waters, it took about 40 days or 3 times as long as that took at the Icelandic stations. Since the amount of atmospheric CO2 taken up by surface water depends on the magnitude of sea-air pCO2 difference and the duration for undersaturation, the greater length of time needed for drawing down surface water pCO2 suggests a lesser amount of CO2 taken up by the sea. The rate at which spring blooms progress may be affected by a number of

Figure 18.3. The results of seasonal observations made in 1983 through 1991 at the four groups of stations located around Iceland within approximately 120 miles from her shore. The Northeast group (open squares) was located at about 68°N, 13°W; the North group ("x" symbols) at about 68°N, 19°W; the West group ("o" symbols) at about 64.5°N, 28°W; and the South group ("+" symbols) at about 63°N, 22°W. The results representing the values in the mixed layer are shown as a function of the Julian day of a year: (a) surface water temperature (°C); (b) pCO2 in surface water at in situ temperature (matm); (c) the total CO2 concentration(mmol kg-1); (d) nitrate concentration (mmol kg-1); (e) phosphate concentration (mmol kg-1); and (f) silicate concentration (mmol kg-1). The curves indicate a general seasonal trend.

Figure 18.4. Seasonal changes in the CO2 and nutrient chemistry in the vicinity of the NABE site, 47°N and 20°W. Takahashi et al. (1993).oceanographic and biological factors including the mixed layer thickness, number of daylight hours, and dynamics of the food web. Thus, an improved understanding of mechanisms controlling the duration of phytoplankton bloom is important for CO2 uptake by the Atlantic Ocean.
A comparison (Table 18.2) of the NABE station data with the seasonal data obtained at the BATS station (31.5°N, 64.1°W) by Tony Michaels and Nick Bates of the Bermuda Biological Station for Research reveals tantalizing features. The total CO2 concentration in surface waters at the BATS station varied seasonally as much as 60 umol/kg, which is similar to 80 umol/kg observed at the NABE site (47°N). At the BATS site , the concentration of phosphate remained less than 0.05 umol/kg throughout a year, and that for nitrate changed from 1 umol/kg during the winter to less than 0.1 umol/kg during the summer. In contrast, at the NABE site, the seasonal changes were 0.6 umol/kg for phosphate and 8 umol/kg for nitrate, and were 8 to 10 times as large as those observed at the BATS site. While the CO2 changes at the NABE site can largely be accounted for in terms of the changes in nutrient concentrations and the Redfield ratio, those at the BATS site cannot. "Why is the CO2-to-nutrients relationship at NABE so different?" is considered to be a first order biogeochemical question. It may be speculated that, for example, at the NABE site, the nutrients may be supplied mainly by lateral transport, whereas at the BATS site, they may be supplied into the photic zone mainly via vertical transport across the bottom of the mixed layer. In these different environments, the nitrogen cycle in photic zone may be entirely different. The depth of nutricline with respect to the photic zone may also be an important factor.
Table 18.2 - Seasonal changes observed in surface waters at the BATS and NABE sites.
______________________________________________________________________________ Seasonal Changes Seasonal RangesLocations Dtemp. DTCO2 NO3 PO4
(°C) (umol/kg) (umol/kg) (umol/kg)
---------------------------------------------------------------------------------------------------------------------- BATS (31.5°N) 9 40 - 60 0.1 - 1.0 0 - 0.05
NABE (47°N) 5.5 80 0 - 10 0 - 0.6
______________________________________________________________________________
4. Differences between the North Atlantic and North Pacific Oceans:
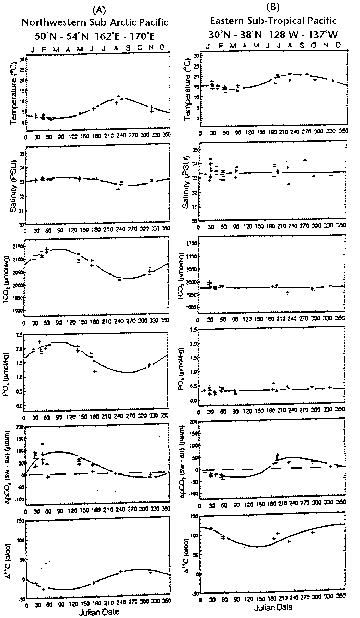
In contrast to the abrupt changes observed at the Icelandic and North Atlantic stations, the data obtained in the subarctic northwestern sector of the North Pacific Ocean show more sinusoidal patterns of seasonal changes (Figure 18.5-A). Similar to the North Atlantic, surface water pCO2 was higher during winter due to the upwelling of subsurface waters rich in CO2, and was lower during summer due to photosynthesis. The Northwestern Pacific became a strong CO2 source during the winter and a sink during the summer, while it was a net CO2 source on the annual basis. This may be attributed to the nutrients not being completely utilized by photosynthesis and, hence, the total CO2 and pCO2 were not drawn down to the lowest level attainable with the complete utilization of nutrients as observed in the North Atlantic. Existing postulates for incomplete utilization of nutrients (iron hypothesis; phyto-zooplankton dynamics hypothesis; mixed layer dynamics) must be further tested using more advanced methods and scientific frame work.
Observations made in the eastern subtropical North Pacific provides yet another type of seasonal changes (Takahashi et al., 1993). Figure 18.5-B shows an oceanic area where TCO2 was almost constant throughout a year and the nutrient concentrations were nearly zero also

Figure 18.5. Seasonal changes of temperature, salinity, total CO2 concentration, phosphate concentration, sea-air pCO2 difference, and D14C observed in the surface mixed layer waters of the northwestern subarctic Pacific (50°N-54°N; 162°E-170°E) and eastern subtropical Pacific (30°N-38°N; 128°W-137°W).
throughout a year. As a result, the seasonal change in surface water pCO2 depended mainly on temperature. This may be due to the presence of a strongly stratified mixed year. While the low levels of nutrients in this area resemble those observed at the BATS site, the large seasonal changes in TCO2 observed at the BATS site appear to be missing from the NE Pacific. This is another question which needs to be answered for a better understanding of the effect of marine biological activities on the oceanic CO2 sink/source.