11 Mesoscale Ocean Dynamics and Biological Productivity
Dennis McGillicuddy
Woods Hole Oceanographic Institution
Department of Physical Oceanography
Woods Hole, MA 02543
A biological model of upper ocean productivity has been incorporated into a mesoscale eddy resolving physical model of the open ocean (Figure 11.1). The physical model consists of a quasigeostrophic interior with a fully coupled surface boundary layer. The nitrogen based biological model includes nitrate, phytoplankton, heterotroph and ammonium fields. This interdisciplinary model system is used to examine aspects of the 1989 JGOFS North Atlantic Bloom Experiment data set.

Figure 11.1. A schematic diagram of the interdisciplinary model system.
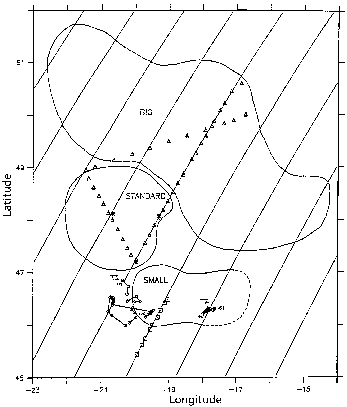
The data set is comprised of two time series of observations taken from different water masses in the mesoscale environment (Figure 11.2). The general features of the two time series are well represented by a one dimensional model when the mesoscale spatial variability in the initial condition is treated explicitly within the one dimensional framework. However, a significant bias is evident in the first time series (Figure 11.2, track T1, days 115-128) as the

Figure 11.2. Mesoscale eddy analysis for the period 8-24 May 1989 from Robinson et al. (1993) derived from hydrographic and Geosat altimetric data. Big, Standard and Small are all cyclonic features. The two main biological time series are indicated as T1 and T2.
sampling pattern began in a warm feature and moved toward colder ones. Mistaking spatial for temporal variability in this case results in an apparent sink of heat and source of nitrate in the data. Removing this bias results in an f-ratio that is almost a factor of two higher (0.64) than computed by Bender et al (1994) based on nutrient inventories and primary productivity measurements (0.37).
The second time series (Figure 11.2, track T2, days 142-151) was conducted in the interior of a mesoscale feature and spatial biasing is minimal. The one dimensional model forms a seasonal thermocline and nitracline that compare quite well with the data in both magnitude and vertical extent. A subsurface ammonium maximum is generated by the model from an initially homogeneous profile that also agrees well with the data. Simulated primary productivity profiles match 14C incubations except on the final day of the simulation when surface nutrients appear in to have been exhausted slightly prematurely. Computed f-ratios are consistent with independent estimates based on uptake measurements.
A systematic parameter dependence and sensitivity analysis has been carried out on these results. The most sensitive parameters are the phytoplankton and heterotroph maximum growth rates. Detailed analysis of the behavior of the system indicates tight coupling between phytoplankton production and heterotrophic consumption even in the early stages of the bloom.
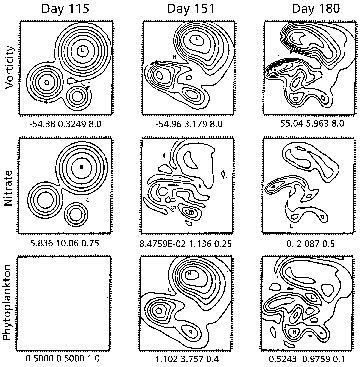
Having tuned the interdisciplinary model to the NABE data in one dimension, the full three dimensional model is used to study importance of mesoscale dynamical activity. Three dimensional dynamical effects dominate the late bloom and post bloom biological fields (Figure 11.3). The three cyclonic eddies in the vicinity of the experiment evolve and interact very strongly during this period. Intense vertical motions associated with these interactions cause significant fluxes of nutrients into the euphotic zone. Nutrient enhancements of up to an order of magnitude occur in the simulations that substantially increase both plant and animal production in localized regions of several tens of kilometers for periods of weeks.

Figure 11.3. Maps of vorticity at 50m (nondimensional), mixed layer nitrate (mM), and mixed layer phytoplankton mM), in the initial condition on day 115 (pre-bloom), day 152 (late bloom), and day 181 (post bloom). Note that the mixed layer nitrate concentration on day 181 inside the standard eddy is in excess of 2mM, when the background concentration is approximately 0.2 mM.
In order to begin to assess the generality and overall efficacy of this eddy interaction mechanism of nutrient transport, further modeling work has begun in the Sargasso Sea. The year
long time series of synoptic realizations of the mesoscale eddy field collected during POLYMODE is being used together with the interdisciplinary model system tuned to the time series data at Bermuda. Data assimilation techniques are being used to generate space time continuous physical and biological fields that will form the basis for both process studies and integrated flux estimates. Although there is little biological data available during POLYMODE, patterns and statistics of near surface chlorophyll distributions derived from CZCS imagery are useful for comparison with model generated fields. Preliminary analysis of the imagery for the POLYMODE region indicates the presence of significant mesoscale variability throughout the year.
In considering the possibility of conducting a biogeochemical control volume experiment, it is my opinion that the dominant scales of spatial and temporal variability must be dealt with explicitly. Experience in the Northeast Atlantic shows that mesoscale eddies can cause significant fluxes of nutrients into the euphotic zone. If a CVE were to be staged in the Sargasso Sea, it is likely that similar types of features will be encountered. It is well known that the Sargasso Sea is densely populated with mesoscale features. In addition, analysis of CZCS imagery shows significant biological variability on these same spatial scales. It therefore appears that mesoscale phenomena must be adequately resolved in a CVE of the sort being discussed here.