10 Water Column Changes at the Marine Light-Mixed Layers Site
John Marra
Lamont-Doherty Earth Observatory
Palisades, NY 10964
This presentation is a summary of results from the "Marine Light-Mixed Layers" (ML-ML) program to the boreal North Atlantic (vic. 60N/20W) in spring of 1991. The results will be published this year as a Special Section in JGR Oceans. I drew from several of these papers in the consideration of the problem of measuring the dynamics of the water column as they influence plankton biology. ML-ML was not designed to measure the flux of production to depth, a primary objective in JGOFS, however many of the results of the program can contribute to the understanding of the balance of carbon in water masses, and how physical processes can regulate changes observed in the water column. The results, therefore, may bear on discussions to plan an experiment designed around the idea of a "control volume."
Despite the gains in recent years made in measuring and understanding primary production in the ocean there remains the problem of validating rate measurements in incubations with changes in the water column. The problem can be sub-divided into two parts. First, one cannot always be assured of sampling the same water mass. Second, there are the well-known inherent uncertainties in many incubated rate measurements. Water column changes will always be measured as net community production, and incubation techniques will only estimate this roughly.
We describe the events transpiring during a short cruise to the Marine Light-Mixed Layer (ML-ML) site. The program in 1991 consisted of a mooring with physical and bio-optical sensors, and cruises to visit the mooring just after its deployment and before its recovery. To study the temporal changes from shipboard, we employed a drifter-following sampling regimen. The drifters were deployed on three separate occasions primarily to follow changes in surface layer oxygen, but also to conduct in situ 14C assimilation experiments. Water column profiles and sample collections were made near the drifters as often as practicable (Figure 10.1).
Just after the mooring deployment, a short cruise (6-12 May) mapped a 100 km square area centered on the mooring. That cruise documented high surface chlorophyll concentrations to the southwest of the mooring, and a bloom of Phaeocystis. Sampling began at surface chlorophyll concentrations of 3-4 mg m-3.
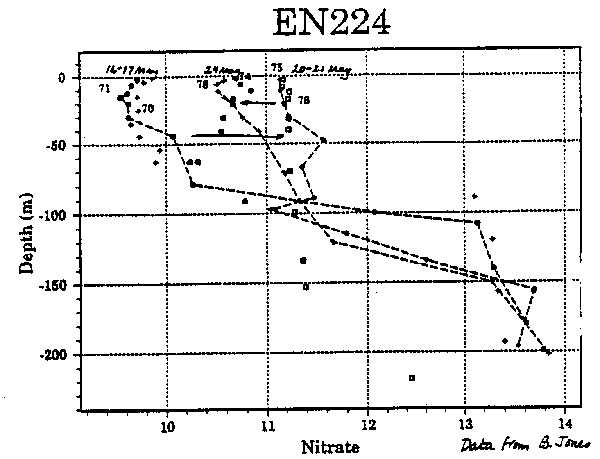
Our indications were that the shipboard measurements matched very well the observations from the mooring (Figure 10.2). During this first few days of the cruise, the mixed layer deepened, and then mixed as a result of two wind events. (Figure 10.3). The second of these was an intense storm, mixing the water column to >200m, and apparently obliterating the Phaeocystis bloom. Chlorophyll declined to <1.0 mg m-3. Over the entire period, nitrate concentrations in the upper layers increase from 16-20 May by 1.7 uM N in the euphotic zone (mixed layer), and then begin to decline by about 0.3 uM d-1 with the new growth following the storm (Figure 10.3). After the storm, Calanus finmarchicus appeared in the surface layer in high abundances. Measurements of microzooplankton grazing at this time, suggested that they were consuming 100% of the primary production.

Figure 1. Trajectories of drifters with respect to the ML-ML mooring (filled square) for cruise EN224 (A) and EN 227 (B). (From Langdon et al., 1995, J. Geophys. Res. 100 (C4), in press).
The results of the comparison between incubated and water column estimates of production are summarized in Table 10.1. While the 14C estimates agree with that expected from a bio-optical model, they are substantially greater than the water column estimates. Those agree, if only in sign. After the storm, when the water column re-stratified, the agreement between the various estimates is better. We concluded that the Phaeocystis bloom we observed was terminated through vertical mixing. After the storms, zooplankton grazing was responsible for losses to the phytoplankton.

Figure 2. Comparison of temporal changes observed at the ML-ML mooring and at a drifter for the cruise EN224 (May, 1991). A. Sea-surface temperature, B. Chlorophyll a, C. Beam attenuation coefficient. The chlorophyll data from the mooring are sub-sampled for nighttime values because of a large photoinhibition effect on in vivo fluorescence. (From Langdon et al., 1995, J. Geophys. Rs. 100(C4), in press)

Fig. 3. Successive temperature profiles collected by s shipboard CTD. For ease in visualization, each cast is offset in temperature by the specified time. The times of the two storms are indicated by the triangles along the top axis.

Fig. 4. The change in nitrate concentrations during cruise EN224. Data courtesy of B. Jones, USC.