ABSTRACT
An extensive set of high quality ADCP current data has been collected on seventeen cruises to the northern Arabian Sea. The data collection period is eighteen months between September, 1994 and January, 1996. The Arabian Sea Project is part of the U.S. JGOFS program involved by multi-institutions to investigate the ocean carbon fluxes under the monsoon conditions. The main objective of our ADCP measurements is to gain understanding of the upper ocean current response to the strong seasonal-varying wind and heat fluxes over the Sea. In the study of preliminary analysis, we examine the annual and seasonal current means, and the meso-scale variability in the upper 400 meter water column.
Tidal currents are determined as barotropic, using depth-averaged current meter (CM) data at 15.5N, 61.5E. The amplitude of major constituents M2 and K1 is between 2 and 5 cms-1, and are relatively significant near the Omani coast and around Ras al Hadd. Comparisons of CM and ADCP data show high correlations up in range of 50 km from the site.
We selected the data over the main JGOFS transect from 18.45N, 57.3E to 14.45N, 65E, repeatedly taken 12 times during the 9 cruises from TN042 to TN053. The transect of length 1000 km is approximately perpendicular to the Findlater jet. A prominent feature is wave of wavelength 200 km existing during the experiment. The wave in most cases extends deeper than the maximum range of the ADCP. The seasonal velocity progression, annual mean and variance will be presented.

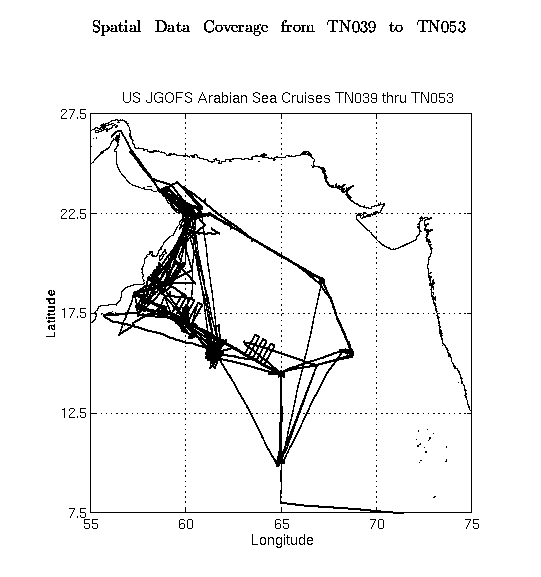
Figure 1: ADCP data coverage in the northern Arabian Sea from cruises TN039 through TN053 for September 1994 to November 1995: There are three types of tracks covering most of the northern Sea (Process cruise), southwest (SeaSoar cruise) and visiting current meter moorings site (mooring deployment/recovery cruise). Each cruise takes same course repeatedly during the JGOFS Arabian Sea Project.
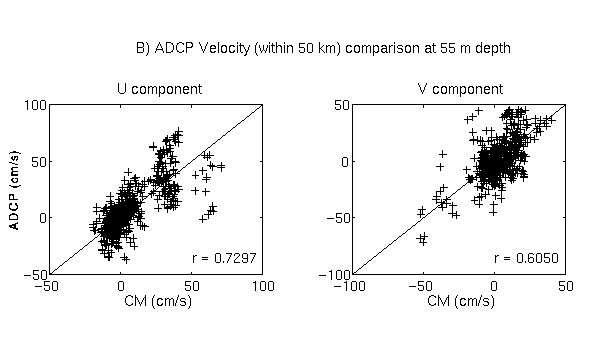
Figure 2: Comparisons of CM and ADCP data: A) an example in time series of data at 25 m depth with the ADCP data taken within 50 km from the site. Complete comparison is presented in Table 1, including correlation coefficients, means and standard deviation.
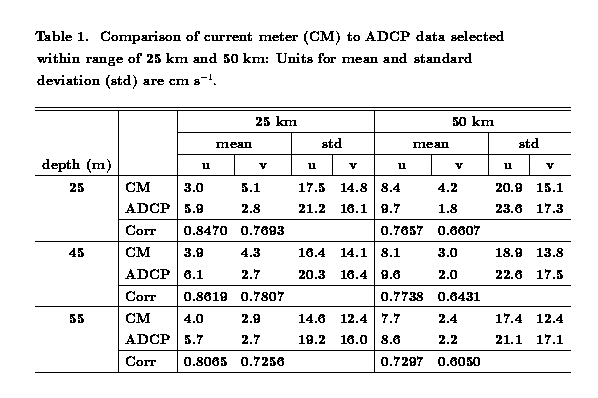
Table 1. Comparison of current meter (CM) to ADCP data selected within range of 25 km and 50 km: Units for mean and standard deviation (std) are cm s-1.
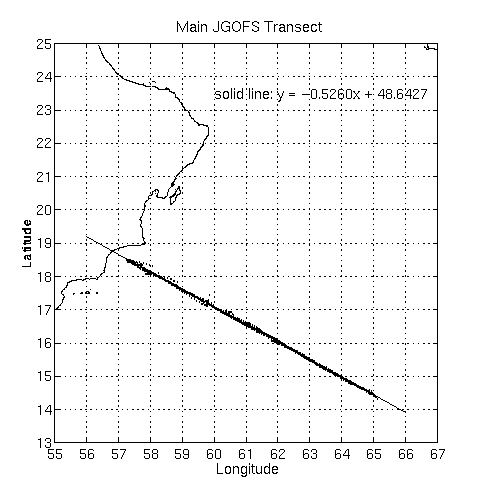
Figure 3: Twelve transects along the main JGOFS line from cruises TN042, TN043, TN044, TN 045, TN048, TN049, TN050, TN 051 and TN053. (The cruise and specific time which the data were taken along the transect are shown in Table 2.) They are exactly on the same line of length about 1000 km, and are approximately perpendicular to the Findlater jet (oriented 62.3°T from true north).
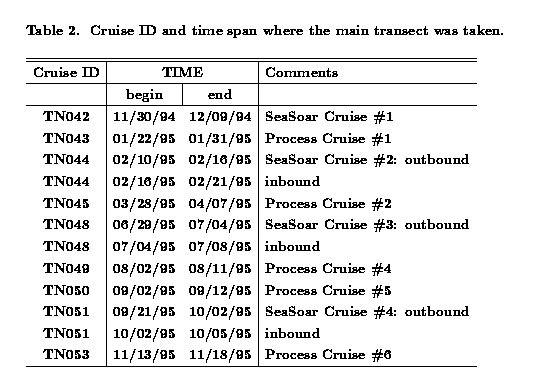
Table 2. Cruise ID and time span where the main transect was taken.
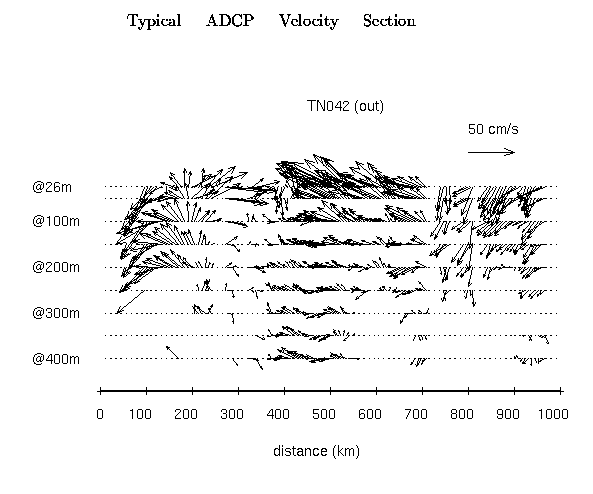
Figure 4: Example of ADCP observations subsampled at different depths from cruise TN042 (11/30/94 to 12/09/94). Each vector is transformed onto the transect coordinates. There are waves of dominant length between 100 km to about 300 km. This meso-scale features are consistently observed in the rest of the data. The maximim range of the ADCP is over 400 m. However due to vertical diel migration of scatters such as euphausids and mictofids at sun set and sun rise, the penetration range decreases to 200 and 250 meters during the night. Nevertheless, the feature seems to extend deeper than 400m.
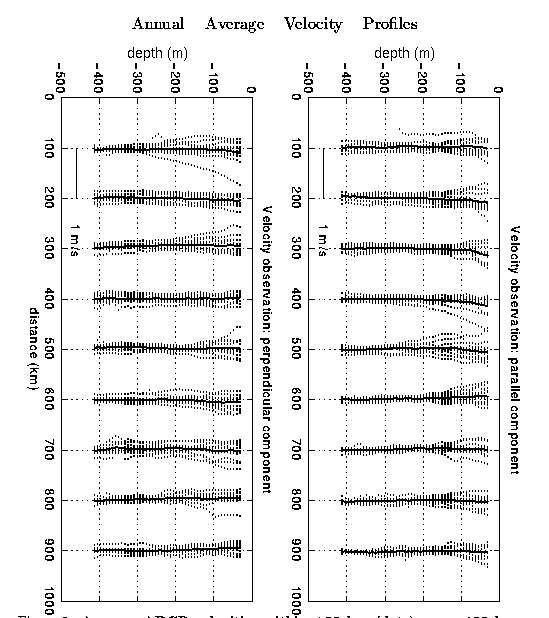
Figure 5: Average ADCP velocities within ±50 km (dots) every 100 km point for each cruise (shown in Table 2), superimposed on the annual mean velocity (thick solid lines). Maximum observations are around 60 cm s-1 for the parallel (southeast/northwest) component and 75 cm s-1 for the perpendicular (northeast/southwest) component during a couple of episodes. Typical magnitude however is about 50 cm s-1. The variation of velocity is pretty much depth-independent. Maximum variance occurs at 500 km offshore for southeast/northwest component, whereas it is found at 700 km seaward for northeast/southwest component. Minimum variance of the perpendicular component seems to occur every 200 km from the coast (will be discussed with Figure 7). In particular the variance for perpendicular component is evidently larger than for the other component.
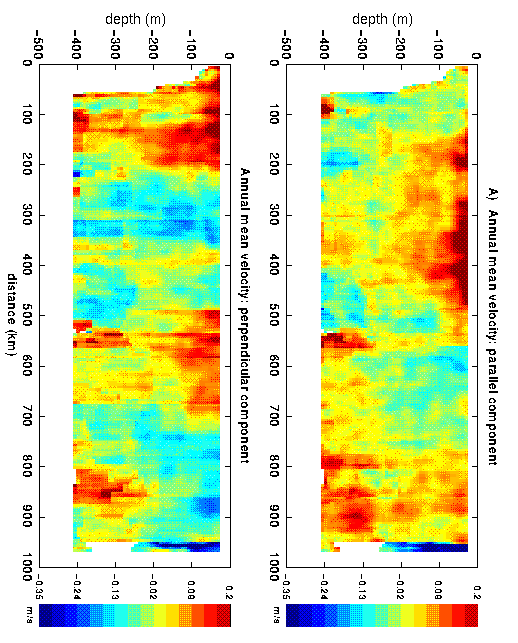
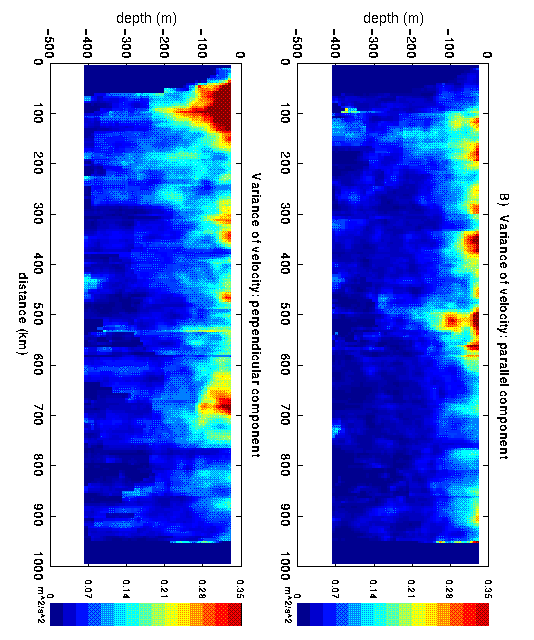
Figure 6: Color figures for annual mean velocities (A) and variances (B). Maximum average velocity no more exceeds than ±24 cm s-1 for both components. In upper and lower plots in figure A we notice that extreme velocities occur every 200 to 300 km distance in alternate. In figure B, the parallel component shows large variance at 500 km offshore, whereas the largest variance for the perpendicular component occurs 100 km off the Omani coast because of one episode of strong coastal current during July, 1995 (TN048). Its second largest variance is observed at 700 km.
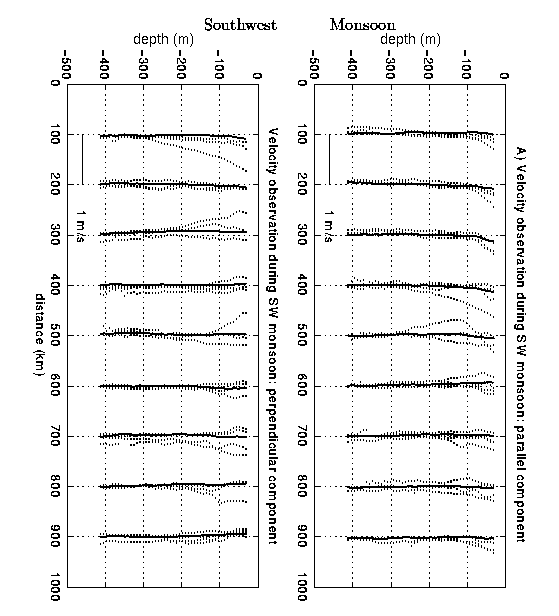
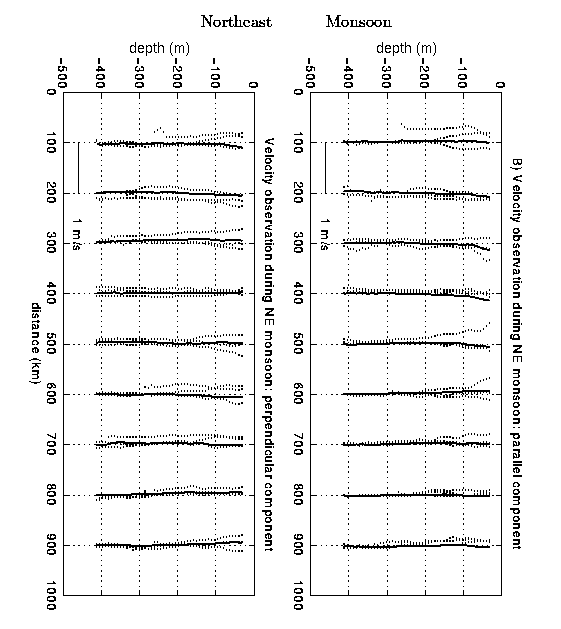
Figure 7: Comparison of seasonal velocity observations during SW monsoon in A (cruises TN042, TN043, and TN053) and NE monsoon in B (cruises TN048, TN049 and TN050). In SW monsoon, the parallel component shows an offshore flow during most of the time. It is particularly significant in the upper 100 meters within 300 km distance from the shore (upper panel in figure A). The perpendicular component (in bottom panel of figure A) is more energetic than the other component, and seems to have minimum variance at 200, 400, 600 and 900 km. When NE monsoon prevails (figure B), the currents are relatively calm and depth-independent, compared to the other season.
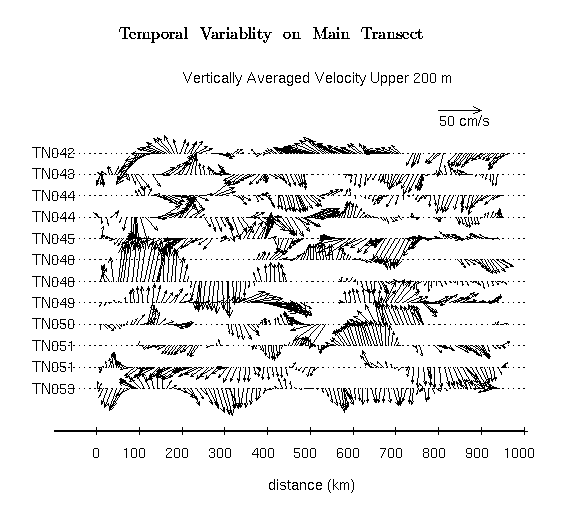
Figure 8: Stick plots of the depth-average ADCP velocities over the upper 200 m for each cruise. During winter there are currents to southwest between 600 and 950 km offshore (TN042, TN043 and TN044). However there is no notable ocean response, particularly during the peak of SW monsoon (TN048). The meso-scale eddy found 900 km offshore during TN042 moves inshore at later cruises (TN043, TN044, and TN045). The propagation speed varies between 4 to 8 km day-1.
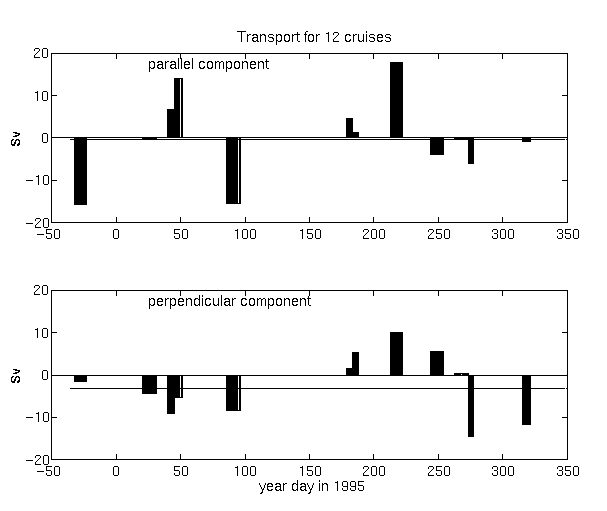
Figure 9: Estimates of total transport for each cruise (x-axis in day of 1995). Thickness of bar is the duration of cruise. Solid lines represent annual mean values for parallel (upper panel) and perpendicular (Lower panel) components. There are approximately same amount of data gap in each cruise except TN048 (the first). Nevertheless, southwest/northeast transport shows seasonal response to the varying monsoon wind (see lower panel).
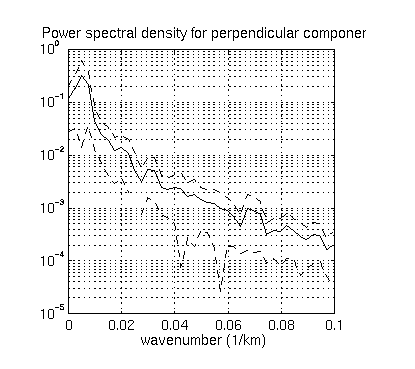
Figure 10: Power spectral density (thin solid line) for velocity of the 200 m depth-average ADCP data. X-axis is wavenumber (1/km), and dashed lines are 95% confidence limits. A dominant wavelength is found at 200 km. There is secondary energetic wave around 150 km.
Summary
The upper currents along the main JGOFS transect have been analyzed using high quality ADCP measurements repeatedly collected over a one year period. We consistently observe waves whose wavelengths are larger than 100 km. From power spectral analysis a dominant wavelength of 200 km is determined. The meso-scale eddy observed offshore during early cruises (TN042, TN043, TN044, TN045) propagates westward with a speed of 4 to 8 km-1, which is comparable to the speed of long Rossby waves observed in the FSU (University of South Florida) numerical model hindcasts. The meso-scale feature is depth-independent and often penetrates beyond the maximum range of the ADCP. However, due to vertical excursion of euphausids and mictofids we obtain velocity only in the upper 200 to 250 m during night. The transport across the transect is about 10 Sv in each season. There are significant water mass movement (up to ~ 18 Sv) in offshore direction.
Acknowledgement: This work founds upon significant help and assistance from many people. First we would like to thank George White, Mike Realander, William Peterson, Tony Burke and Mike Grogan for their technical assistance in setting up and running the AutoADCP system on the Thompson, and help in collecting the ADCP data. We also want to express great appreciation to Dr. Eric Firing in the University of Hawaii for the help to install the CODAS system and have it running on our UNIX computer. Special thanks must be mentioned to Frank Bahr who kept the ADCP system running properly during his cruises and made comments to improve data processing. Lastly we would like to extend thanks to the Thompson's crew who contributed to the cruises.